Explore the Diversity Geomap Dashboard
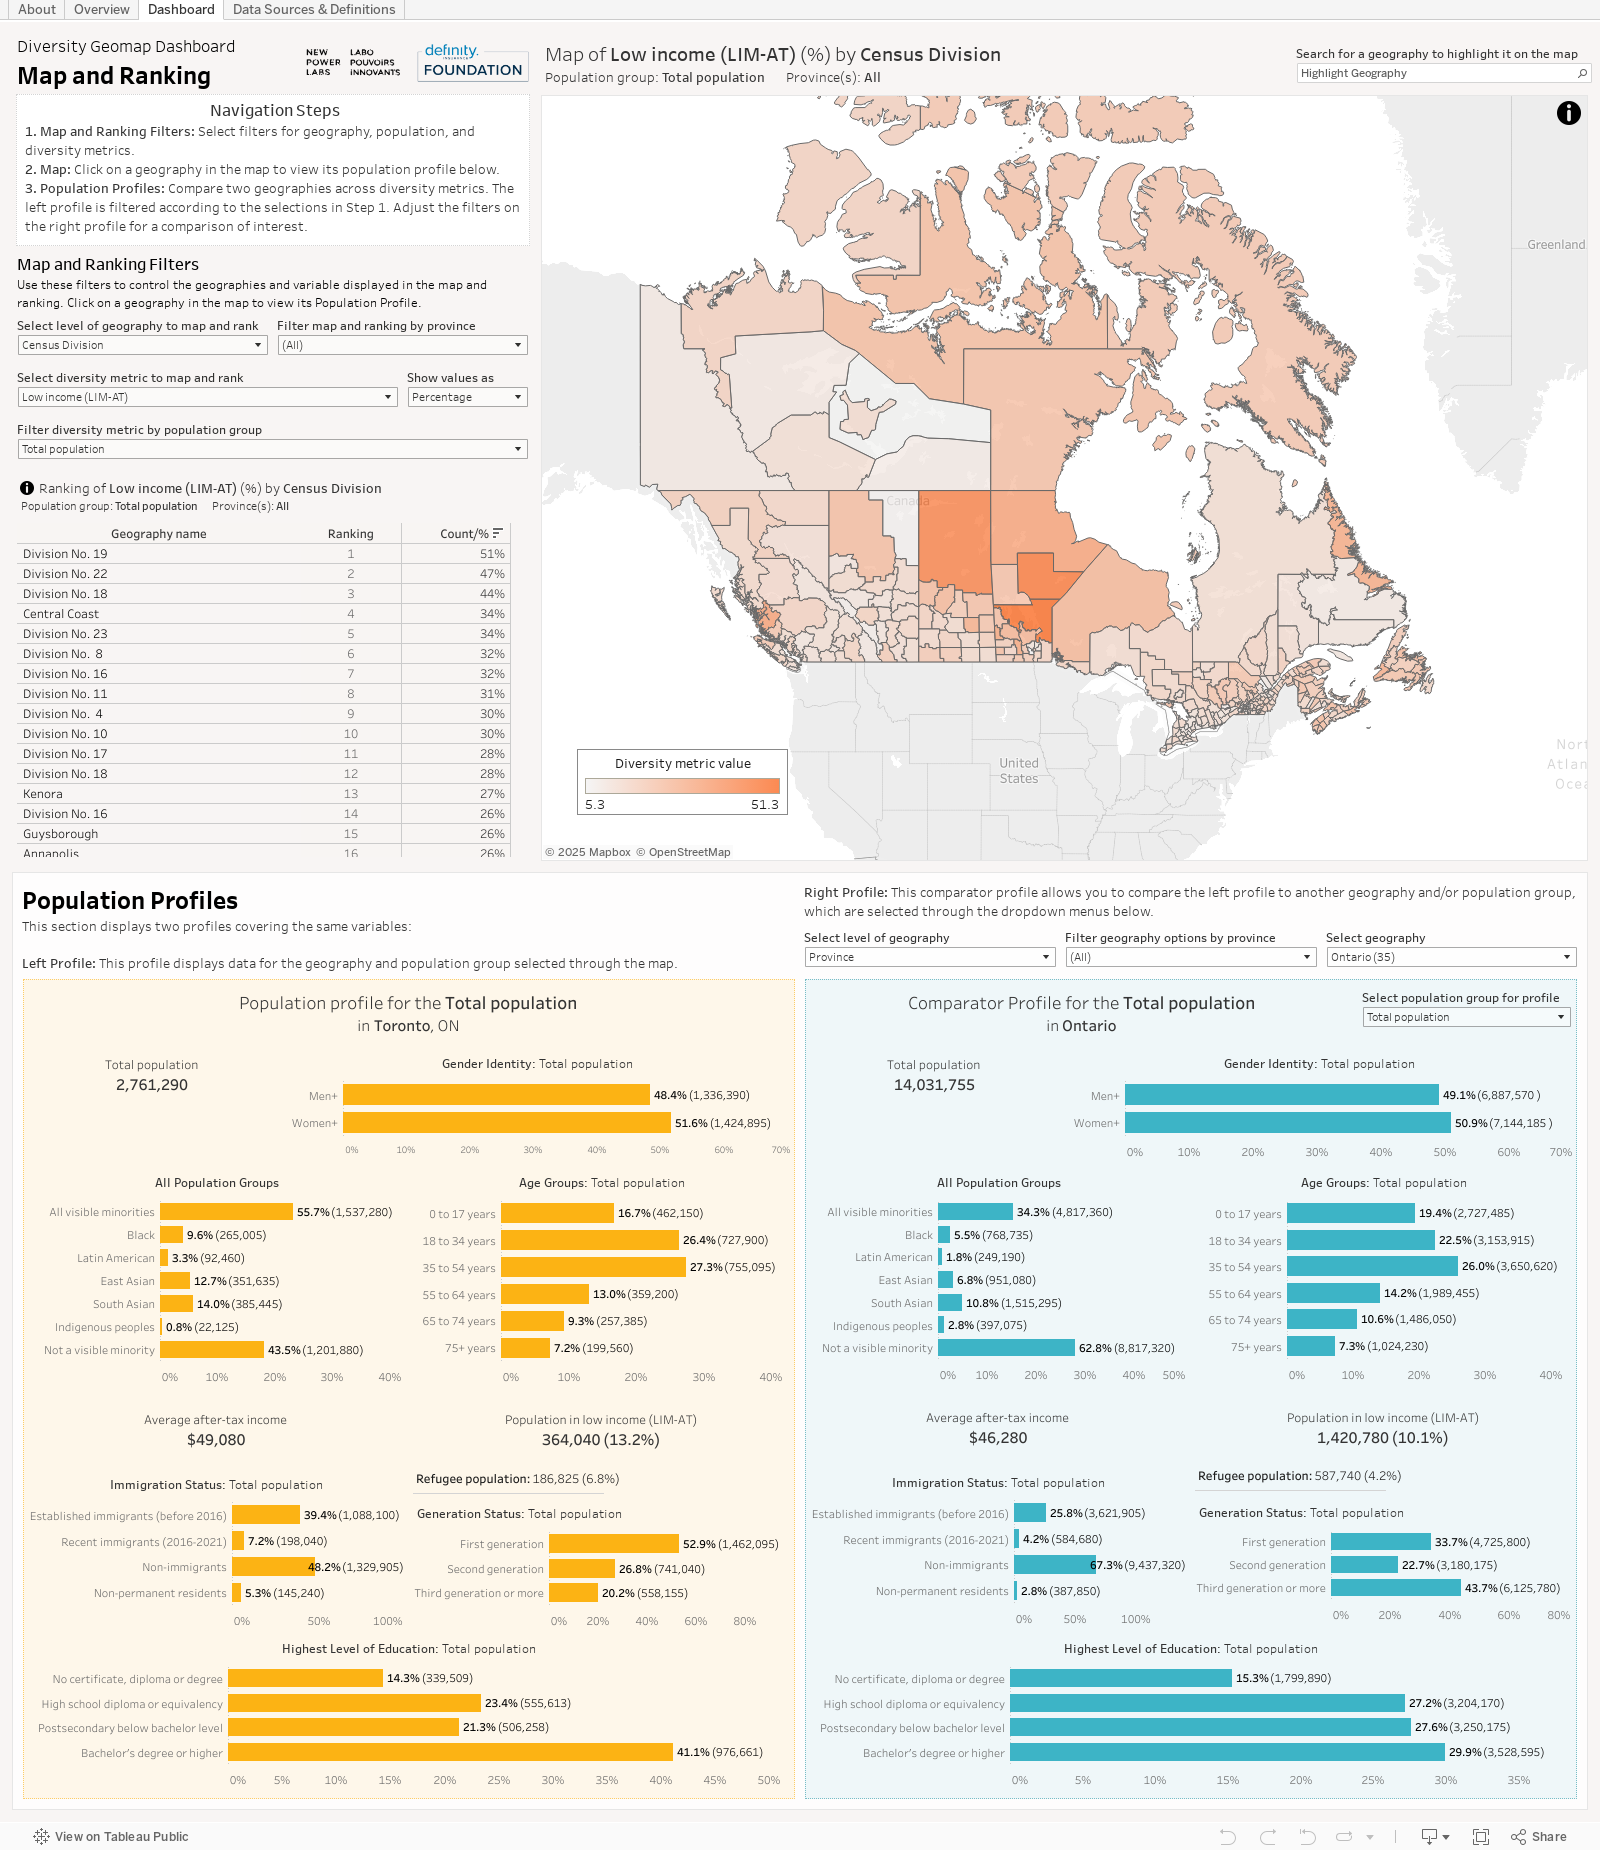
The Diversity Geomap Dashboard, a partnership between Definity Insurance Foundation and New Power Labs, helps you see the diversity of the people and communities in the regions where you invest, grant or work using data from the 2021 Census
This tool helps funders, impact investors, and community organizations to compare community diversity metrics with their capital allocation targets, identify investment priority areas, and support strategic planning.
With the Dashboard, you can filter by diversity metrics (Age, Gender, Immigration Status, Education, Income), geography (Province and Census Divisions), and population groups (Total Population, Visible Minorities, Black, Indigenous, Latin American, South Asian, and East Asian) across Canada, to:
The Dashboard is optimized for viewing on desktops/laptops.